Oil & gas by state
California
Eighth among oil states, down about a quarter in five years, and still mostly Kern County.
Live, updated weekly
At the pump this week
Regular gasoline
$6.10
Diesel
$8.09
California average, week of Oct 12, 20263
By the numbers
Neck and neck with Wyoming
California averaged 288,000 barrels a day in 2025. Wyoming, in seventh, averaged 289,000. By July 2026 California was down to 245,000 and still eighth.
Worth knowing
Five things about California oil
Kern carries the state
Kern County produced 83.2 million of California's 113.5 million barrels of oil and condensate in 2024, and about 81% of its gas.2
A few old giants do the work
In 2021 Midway-Sunset, South Belridge and Kern River were the top three fields. The top 10 fields made 87.5% of the state's oil.6
The first well is a landmark
Pico No. 4 in Pico Canyon was completed in 1876 at about 25 barrels a day from 370 feet. It's California Historical Landmark No. 516 and has been a National Historic Landmark since 1966.7
Kern permits have a ceiling
SB 237 (2025) lets CalGEM approve up to 2,000 new Kern well permits a year on the county's environmental review, until Jan 1, 2036.8
More gasoline comes from outside
Imported gasoline and blending components were 19% of California's supply in 2025.9
History
From Pico Canyon to Kern
California's oil story starts in a canyon north of Los Angeles. People had used the tar seeps for centuries. In 1876 a crew at Pico Canyon finished a well called Pico No. 4. It came in at about 25 barrels a day from 370 feet. Deepened to 560 feet, it made about 70.7
That's not much by today's numbers, but it was enough to build a business on: the state's first refinery, and a company that became part of Standard Oil of California.
Then the action moved over the Grapevine to Kern County. Around 1900 the southern San Joaquin Valley turned into one of the great oil provinces on earth. Midway-Sunset, Kern River, Belridge, Elk Hills, Buena Vista and Coalinga are still household names in the oil patch. A lot of that oil is heavy and thick, so California crews got very good at moving it: steam floods, cyclic steam and tight well spacing.
Kern still produces about three out of every four barrels in the state.
The last 20 years have gone the other way. Production has slid as fields aged and the rules got stricter: setback laws, permit slowdowns and the state's push to phase down fossil fuels. Refineries have started closing.
In 2025 the Legislature passed SB 237, which set out a path for permitting new wells in Kern County again. Whether that slows the decline is the question everybody in Bakersfield is asking.
On the show
California episodes


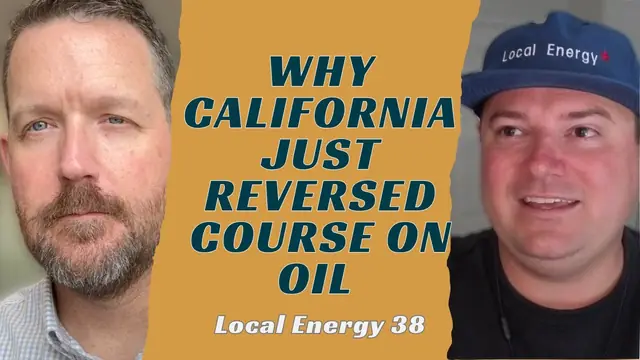
On the record
“…being a steward of the environment in California is the hardest job I've ever had. And that's the one I chose in 2017 when I became an operator instead of a finance guy.”
In January 2025, visiting Los Angeles after the wildfires
“So there can be no golden age without the Golden State.”
He was talking about rebuilding after the fires, not oil. For an oil state that's been shrinking for a decade, the question is whether that golden age includes Kern County.
FAQ
Questions people ask
- How much oil does California produce?
- About 288,000 barrels a day in 2025, or 105.2 million barrels for the year, per EIA. The latest month, July 2026, averaged 245,000 barrels a day.
- Where does California rank among oil states?
- Eighth in 2025 by EIA crude output, essentially tied with seventh-place Wyoming (288,000 vs 289,000 barrels a day). It was also eighth in July 2026.
- Where is most of California's oil produced?
- Kern County. CalGEM's 2024 report puts Kern at about 73% of the state's oil and condensate and about 81% of its gas.
- Is California's oil production going up or down?
- Down. EIA shows a drop from 395,000 barrels a day in 2020 to 288,000 in 2025, about 27%. SB 237 (2025) set a path for up to 2,000 new Kern well permits a year through 2035, but the July 2026 figure is still lower than the 2025 average.
- How many drilling rigs are working in California?
- Five, in Baker Hughes' count for the week ending Oct 16, 2026, down one from the week before.
Other states
Where the numbers come from
- EIA, Crude oil production by state, annual and monthly, thousand barrels a day and thousand barrels. Released Sep 30, 2026. Ranks are among the 50 states, excluding federal offshore; the 2020 to 2025 change is computed. eia.gov ↩
- CalGEM, 2024 Supervisor Annual Report. Kern 83,235,746 of 113,492,512 barrels of oil and condensate; 96,869,858 of 120,150,154 Mcf of gas. Shares computed. conservation.ca.gov ↩
- EIA, Gasoline and Diesel Fuel Update, weekly retail prices: California regular gasoline, all formulations (EMM_EPMR_PTE_SCA_DPG), and California No. 2 diesel (EMD_EPD2D_PTE_SCA_DPG). Read from EIA's API when the page loads. eia.gov ↩
- EIA, Natural gas marketed production by state, 2025 (111,955 MMcf). Released Sep 30, 2026. EIA groups the smaller producers as "Other States." eia.gov ↩
- Baker Hughes, North America Rotary Rig Count, week ending Oct 16, 2026. bakerhughes.com ↩
- CalGEM, 2021 Supervisor Annual Report, field ranking. conservation.ca.gov ↩
- California Historical Landmark No. 516; National Park Service, National Historic Landmark survey (1963), the source of the 25 barrels a day at 370 feet and about 70 at 560 feet. californiahistoricallandmarks.com · nps.gov ↩
- CalGEM, SB 237. conservation.ca.gov ↩
- California Energy Commission, What drives California's gasoline prices. energy.ca.gov ↩
- Compilation of Presidential Documents, DCPD-202500177, Jan 24, 2025. govinfo.gov ↩